![Apps for Tableau logo.png]](https://support.appsfortableau.infotopics.com/hs-fs/hubfs/Apps%20for%20Tableau%20logo.png?height=50&name=Apps%20for%20Tableau%20logo.png)
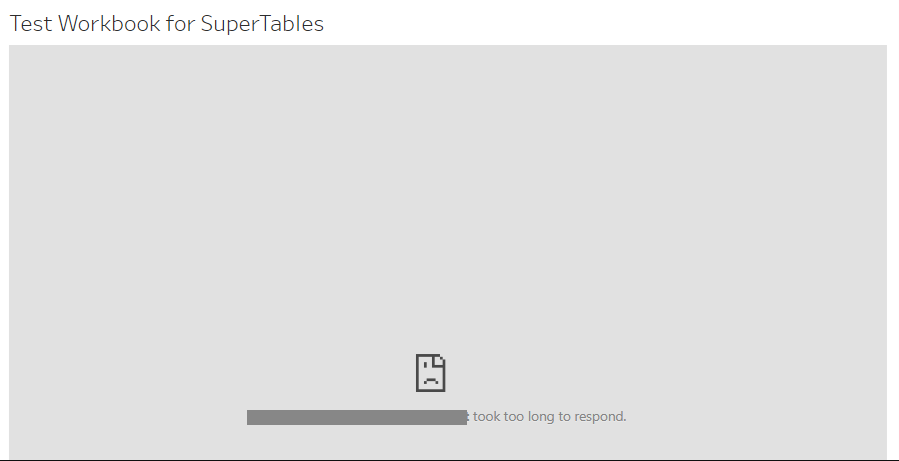
loading the extension took too long to respond.
Start by checking if you can access the extension directly in your browser. You can find the URL in the TREX. Open the extension.trex with a text editor and copy the URL.
If you see the above error message, no connection is possible with the server running the extension. The following things should be checked:
- Is the server behind a VPN?
- Is the server behind a firewall?
- Is the server using a IP Filter?
- Did you configure a DNS rule already?
- Are you using HTTPS?
- Do you have SSL certificates (https) installed?
- Is the extension running?
- Is the extension constraint with X-Frame-Origin issues? This will only occur if the extension is not running in the dashboard but running in the browser directly.
Tips:
Connect to the server (remote desktop for example), try to access the extension in the browser on the server by going to the domain or go to https://localhost. Make sure you use the right port. Do you see the extension? Probably the issue is in the network.